

Resources
Resources
Welcome to our growing collection of resources, featuring a selection of blog posts, webinars, and downloads.
Stay tuned as we continually expand our library!


.svg)

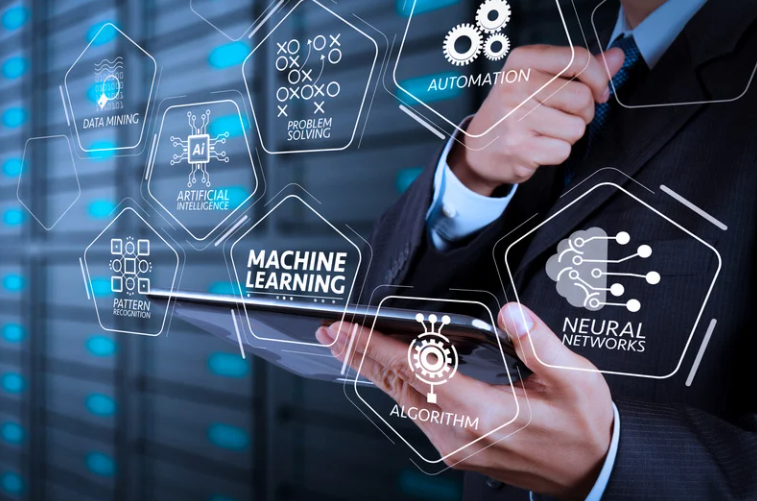
Blog posts
Dive into our blog posts for fresh insights and expert perspectives on the latest in AI forecasting, predictive modeling, and industry trends.


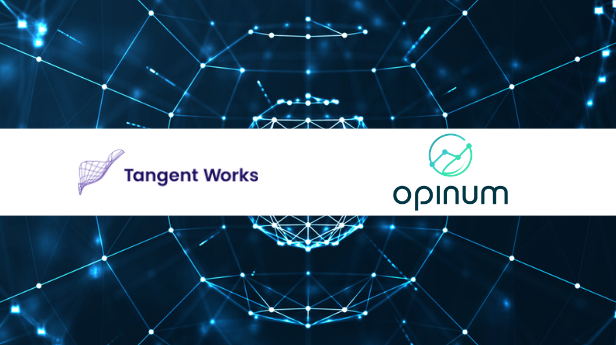
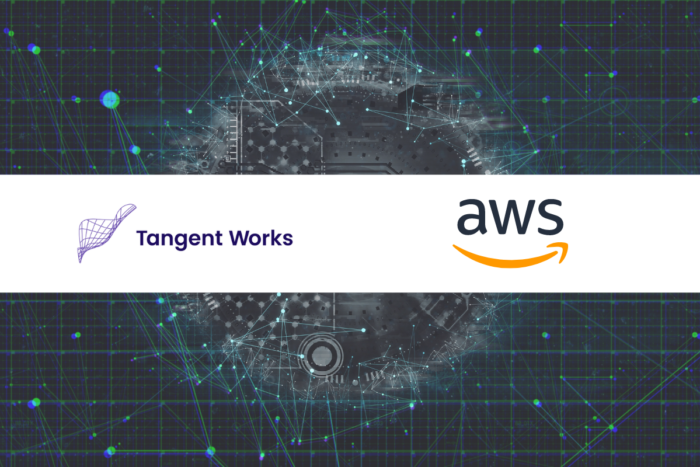
Partnerships
Discover the power of collaboration through our partnerships, where innovation meets expertise to drive mutual success. Read about our latest partnership announcements and insights here.
Case Studies
Explore our case studies, highlighting how customers have leveraged Tangent to solve challenges and drive transformative results in their businesses.


Webinars
Discover our latest webinars, where experts share insights on forecasting, predictive modeling, and innovative uses of data to drive business success.

.png)
Unlock the Power of your Business Data with Tangent
See firsthand how Tangent revolutionizes your approach to data, turning it into actionable predictions that drive success.
Want to add Predictive Power to your software? Get in touch for OEM Solutions